Most charts are fairly inaccessible due to their graphical nature and we should provide an alternative way for users of assistive technologies to consume the same data.
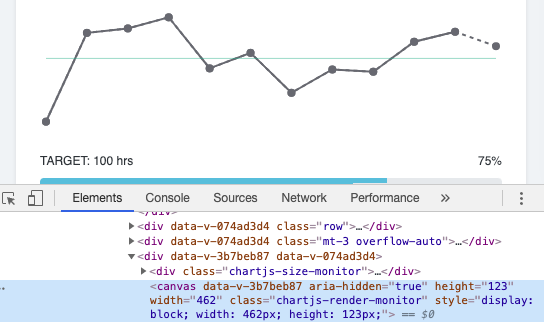
In Freelance Insights I added a simple chart showing the trends of various stats over the last 12 months. This is a very simple graph and is rendered with Chart.js which uses <canvas> to draw the chart. Dead easy for us developers to implement but the single DOM element gives nothing for assistive technology to read.
To make this data available to everyone we need to provide it in an alternative format - one that a computer can easily read. The simplest way to do this is by also providing it in a data table. It's almost certain that the chart is drawn from a 'table-like' data structure with rows and columns so it should be simple to output this.
Freelance Insights is built with Vue.js so I used the following template to output a table of the data:
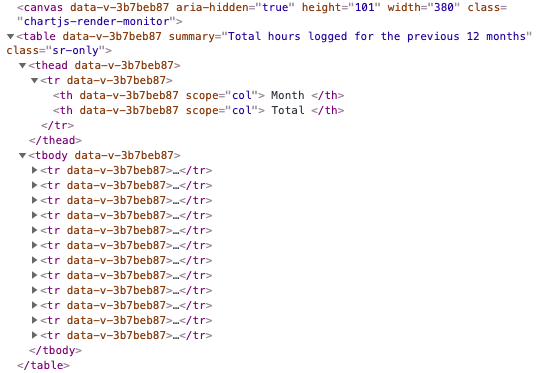
There's nothing fancy about this table, we define a heading section (<thead>) containing two <th> elements for the Month and Total columns. Then we loop over our dataset and output a row for each. We also include a summary of the table's data via the summary attribute to give some context and an overview of the data.
But I don't want a table shown as well as a chart, I hear you shout!
The beauty of this solution lies in the use of the sr-only class which is a utility class you should add to your project. It's actually built into Bootstrap (which I use via Vue Bootstrap in this project). This CSS class renders the element "visibly hidden" (i.e. not visible on the screen), while keeping it visible to screenreaders and other assistive technology. This means that the data table can be interpreted and read aloud, while visually the page remains the same. Easy!
The rules for the .sr-only class is as below - you don't need to memorise it, just drop it in your project and use it.
Lastly, we can add aria-hidden="true" to the canvas element so assistive technology knows to ignore it rather than trying to interpret it incorrectly. This leaves the new data table to present the data.
Today (21st May 2020) is Global Accessibility Awareness Day, so have a think about how you can improve the accessibility of your website and make the web a friendlier place for everyone!