I saw a tweet recently (unfortunately I can't remember which one! I found it! I've embedded it below 👇!) that mentioned someone demonstrating to a colleague how to use the debugger statement in dev tools and how it blew their mind. I thought it would be useful to run over all of the other hidden ways we can debug our JavaScript code in Dev Tools.
I just taught a good developer with 5 years of javascript experience that you can use `debugger;`
— Jess (@_JessicaSachs) September 10, 2020
he is losing his shit right now. he's been debugging with console.log for his entire career.#javascript
By debug I really mean break into our code and see what's happening at a specific point.
The Humble alert Statement
Back in the day, before dev tools were even a thing, we had to resort to littering our code with alert statements to see what was happening. It gives me shudders just thinking about it - I hope none of you are still doing this. If so, please read on and find out the other options! Having said that, it occasionally has it's uses :)
const x = 0;
const y = 0;

for (let z = 0; z < 10; z +=1) {
    alert(z);
}
console.log FTW!
console.log and all of its friends (.warn, .error, .table, .group, .time) are so much more than the next iteration of alert. They are really good for giving you a snapshot of a selection of variables, but aren't so good for helping us understand program flow because they are a snapshot of a point in time which has now changed completely.
const x = 0;
const y = 0;

for (let z = 0; z < 10; z +=1) {
    console.log(z);
}
I will often use console.log to output some info and then use it as a shortcut (click the file/line number link to the right of the output) to go to that particular place in the code and add manual breakpoints.

Set a Breakpoint Manually
For me, setting a breakpoint manually and stepping through the code is the best way to figure out issues and understand the full program flow. Doing so lets us see the state of the program at that specific point in time and make debugging decisions before it changes, which console.log doesn't let us do.
Added breakpoints are usually persisted between page loads so you can make changes, refresh and get back to where you were quickly, which makes them very powerful.
The only downside I find is when dealing with transpiled output and source maps it's sometimes impossible to select the right line due to something which can be frustrating. If that happens to you then I tend to use the next option...
Use the debugger Statement
The debugger statement lets us drop a breakpoint in our source-code which the dev tools will then pause on when it hits that line. This solves the problem I mentioned above because it is baked into the output so there's no way around it for the browser!
const x = 0;
const y = 0;

for (let z = 0; z < 10; z +=1) {
    debugger;
    console.log(z);
}
This technique is also useful for when you can't be bothered hunting down the same file/line in dev tools to add a manual breakpoint or if there isn't time to add a manual breakpoint before your code triggers (for example, if you've a script running immediately after page load).
Conditional Breakpoints
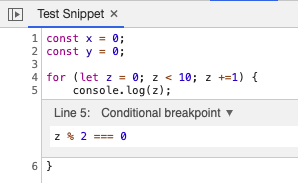
Sometimes you're only interested in debugging a function in specific circumstances. For this we can add conditional breakpoints which will only pause execution if a certain condition evaluates to true. To do this we right click on the line we want to break on, choose 'Add Conditional Breakpoint'.
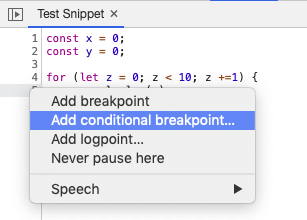
From there a wee text box will appear where we can enter a condition:
We can also use the debugger statement in a similar way by wrapping it in a regular if statement. For example
const x = 0;
const y = 0;

for (let z = 0; z < 10; z +=1) {
    if (z % 2 === 0) {
      debugger;
    }
    console.log(z);
}
Event Listener Breakpoints
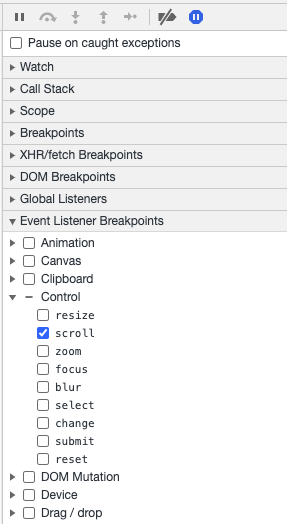
Slightly more niche is the Event Listener Breakpoints which allows us to stop the code when any of the selected events are triggered. This is really useful when you're not sure what code is triggering some behaviour. For example, you want to know what is causing the page to scroll at a random time.
By ticking the Control > Scroll event checkbox, the code will pause and you will be taken to the place where the scroll was triggered.
You can try this by dropping the following code into the console:
document.body.scrollTo(0, 1000);DOM Breakpoints
Another type of breakpoints is ones that can be attached to DOM nodes themselves. Like the Event Listener breakpoints we talked about above, this is good for tracking down code which causes changes.
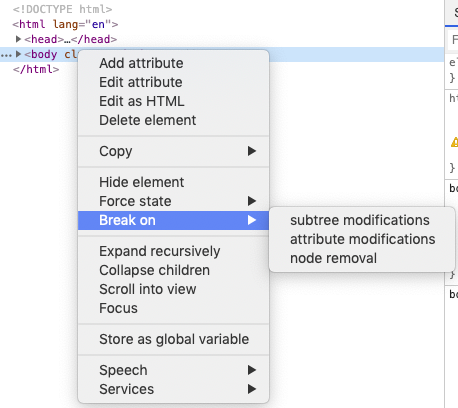
Subtree Modifications
If you right-click a node in the Elements tab expand the Break On menu and click subtree modifications then whenever a child of that node is altered in any way (node removed, attributes changed etc) then the code will be paused and you'll be taken to the line which triggered it.
Attribute Modifications
The attribute modifications option lets us restrict it to just modifications of a node's attributes. This is useful for figuring out when classes are added or removed.
Node Removal
Finally, we can choose node removal which will pause our code when that particular node is removed from the DOM. Again, this is useful for figuring out what code is messing things up!
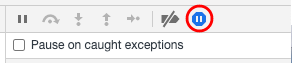
Pause on Exceptions
Another often overlooked option is the Pause on Exceptions toggle. When enabled this will pause our code when it encounters an unhandled exception allowing us to see straight away the conditions that caused it to happen and poke around at the variables' values. Disabling this option will just log unhandled exceptions to the console and continue on its way.
Try this by adding an exception to our code snippet:
const x = 0;
const y = 0;

for (let z = 0; z < 10; z +=1) {
    console.log(z);
    throw 'error';
}
To take things further by enabling this option a checkbox will appear allowing you to Pause on caught exceptions as well. This means that the code will pause even when an exception is handled by a try/catch block. This is useful if exceptions are being swallowed somewhere. The only downside is it can result in tons of pauses in external library code as it runs.
If we wrap our throw statement in a try/catch block and rerun it then it won't pause anymore cos the exception has been handled. However if we check the checkbox and run it again we will see it pause once more.
const x = 0;
const y = 0;

for (let z = 0; z < 10; z +=1) {
    console.log(z);
    try {
        throw 'error';
    } catch(e){}
}
Managing Breakpoints
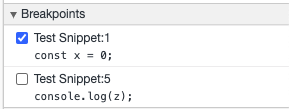
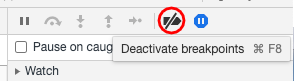
Now that you've got breakpoints littered throughout your codebase you might want to disable some or all of them quickly. The nuclear option is the Disable Breakpoints toggle which turns all breakpoints off or on at once.
Alternatively you can toggle breakpoints off and on individually using the checkboxes in the Breakpoints list. This means you can disable them without actually removing them and having to find that location again to re-add them.